Climate Change
The Teijin Group has designated "climate change mitigation and adaptation" as a key issue. Accordingly, the Group is leveraging lightweight and energy-efficient technologies to contribute to the transition to a carbon-free society. At the same time, the Group is making efforts to reduce greenhouse gas (GHG) emissions from its business activities. In March 2019, the Group expressed its support for the recommendations of the Task Force on Climate-related Financial Disclosures (TCFD) and has since been disclosing information in line with the TCFD framework.
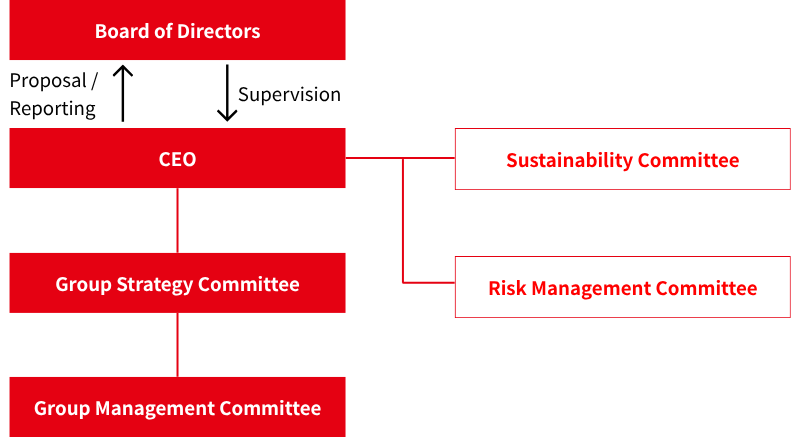
Governance
To implement sustainability activities, including "climate change mitigation and adaptation," the Teijin Group appoints the Chief Sustainability Officer as the person responsible. Under the direction and supervision of the Board of Directors, this officer promotes sustainability initiatives integrated with business operations. Policies and key issues related to sustainability are matters to be resolved by the Board of Directors. In line with these policies, the executive side sets management indicators and implements initiatives, while progress and responses are reported as needed to the Board of Directors by the CEO or this officer for discussion. Furthermore, to ensure prompt and appropriate responses to sustainability issues, the newly established Sustainability Committee, under the leadership of the CEO, deliberates on sustainability policies and promotes initiatives addressing key issues.
Strategy
The Teijin Group views "climate change mitigation and adaptation" as a business growth opportunity and aims to contribute to the sustainable development of society by leveraging the strengths that it has cultivated over the years. For climate change mitigation, we provide solutions centered on lightweighting and enhancing the durability of mobility through high-performance, high value-added materials. In addition, we are working to phase out coal-fired power, promote energy conservation and the use of renewable energy, and focus on technological innovations such as process innovation. For climate change adaptation, we offer solutions that contribute to reducing damage and enabling rapid recovery during natural disasters, such as infrastructure reinforcement materials made from high-performance materials, and support disaster site operations through healthcare services utilizing digital transformation.
Climate Change-Related Opportunities and Risks
| Category | Major opportunities | Time frame | Major initiatives |
|---|---|---|---|
| Opportunities concerning products and services | Short to long term |
| Category | Major risks | Time frame | Major initiatives | |
|---|---|---|---|---|
| Transition risks | Policies and legal regulations | EU Emissions Trading System, etc. |
Short to long term | |
| Market and reputation | Medium to long term | |||
| Physical risks | Acute and chronic risks | Short to long term | ||
Roadmap for Reducing Group CO2 Emissions
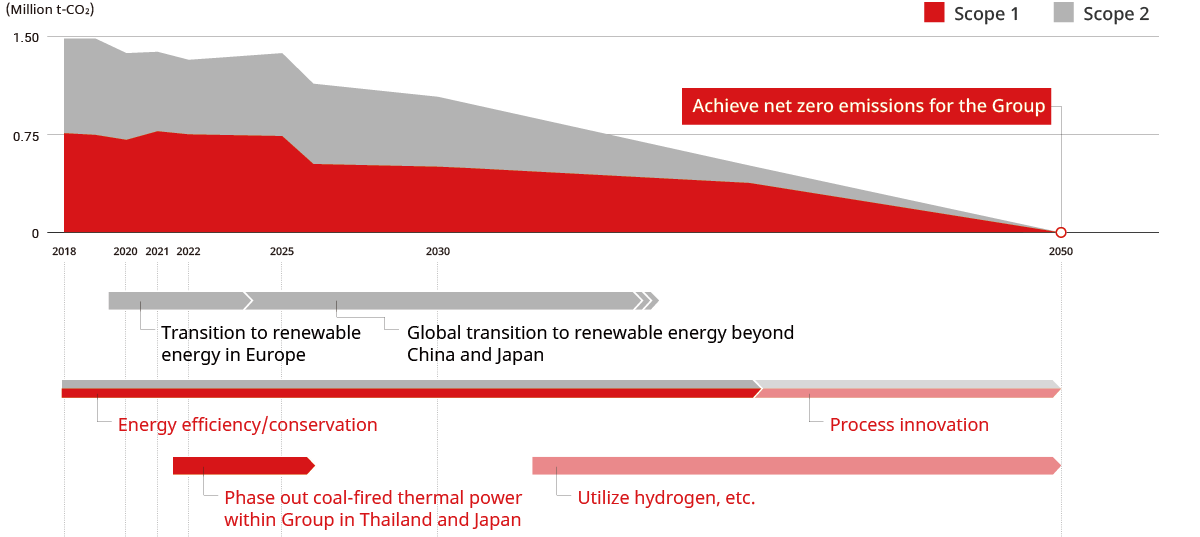
The Teijin Group aims to achieve net zero CO2 emissions by 2050, promoting the shift to renewable energy for power sources and to clean energy for heat sources in line with its roadmap. Renewable energy adoption is progressing steadily in Europe, and developments in China are ahead of schedule. In Japan, following Thailand, decarbonization work is underway at domestic plants and is scheduled for completion by the end of FY2025, with the full-year effects expected from FY2026.
- *Teijin Automotive Technologies NA Holdings Corp. (TAT-NA), a consolidated subsidiary in the Materials segment that was engaging in the automotive composites business in North America, is classified as a discontinued operation and has been excluded from figures for all fiscal years.
Scenario Analysis Related to Climate Change
After identifying businesses and industries that have the potential to be significantly impacted by climate change, the Teijin Group has been conducting an analysis of the level of this impact based on the 1.5℃ scenario and the 4℃ scenario,* referencing World Energy Outlook (WEO), published by the International Energy Agency (IEA). In either scenario, differences in industry trends will have a minor impact on demand, or the positives and negatives will cancel each other out. Nonetheless, we will monitor industry trends and consider the appropriate time to make investments and allocate resources.
- *1.5℃ scenario: IEA NZE 2050 scenario, 4℃ scenario: IPCC RCP8.5
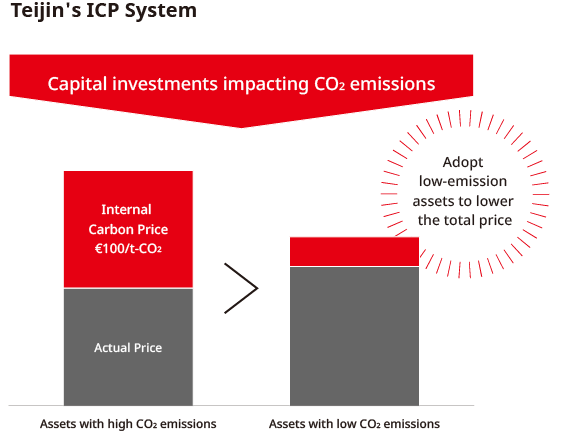
Internal Carbon Pricing System*
In FY2020, the Teijin Group established and introduced an internal carbon pricing (ICP) system targeting capital expenditure plans throughout the Group that can lead to an increase or decrease in CO2 emissions. In FY2021, we began applying this ICP system to our capital expenditures. In April 2023, we revised the ICP system, making changes to such aspects as set pricing and scope of application, taking into account such factors as the raising of our target for Groupwide CO2 emissions reductions and the recent changes in the external environment. With regard to ICP, we raised this price from €50/tons-CO2 to €100/tons-CO2 to better reflect the increased risks of carbon taxes being introduced and rising tax rates as well as higher emissions trading prices in various countries, especially in Europe. We have expanded the application of our pricing system for in-house CO2 emissions to include investments such as M&A, as well as decisions related to reducing emissions that do not necessarily involve capital expenditure, such as switching to renewable energy. In addition, with regard to indirect emissions from partners in our upstream value chain (Scope 3 Category 1), the revised ICP will be applied to capital expenditure for switching to recycled or biomass-derived raw materials purchased from other companies, thereby encouraging the reduction of CO2 emissions throughout the supply chain.
- *A system that creates economic incentives to reduce CO2 emissions by establishing internal carbon prices to quantify CO2 emissions as costs, thereby promoting internal efforts to respond to climate change.
Converting to Gas Cogeneration System at the North Plant of Maruyama Factory
In October 2022, the Teijin Group made the decision to convert the in-house fossil fuel-based power generation facilities currently in use at the North Plant of Matsuyama Factory to a cogeneration system* running on city gas. With regard to the Group's specific targets for net zero emissions by FY2030, allowing for future business growth, this target requires us to reduce CO2 emissions by roughly 600,000 tons compared with FY2018 levels. The introduction of this gas cogeneration system in the North Plant of Matsuyama Factory is expected to achieve a reduction of 200,000 tons a year, or around 30% of this reduction. The total investment is expected to be over ¥10 billion, including the replacement of existing aging power receiving and distribution equipment, and the generating capacity of the new power plant is expected to be approximately 30,000 kW.
- *Cogeneration systems supply both electricity and heat on-site, and their high energy efficiency results in significant reductions in CO2 emissions.
Risk Management
Sustainability risks are managed under the Total Risk Management (TRM) framework. For transition risks related to climate change, we monitor policy trends and formulate a roadmap towards achieving net zero. Within the Teijin Group and across our supply chain, we have introduced an internal carbon pricing system for capital expenditures that involve increases or decreases in CO2 emissions, in order to curb risk impacts. In April 2023, we expanded the scope of this system to include decision-making cases that affect CO2 emissions reductions without capital expenditure, such as investments through M&A or the switch to renewable energy by changing suppliers. For physical risks such as rising temperatures and sea levels, we conduct assessments of water risks and implement necessary measures, while reviewing our BCP as needed and conducting various disaster preparedness drills.
Metrics and Targets
The Teijin Group's greenhouse gas (GHG) emissions targets have been certified by the Science Based Targets initiative (SBTi) as being consistent with the Paris Agreement's scientifically based GHG emissions reduction targets, meeting the "Well-below 2℃" target level.
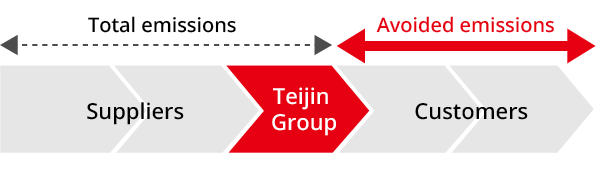
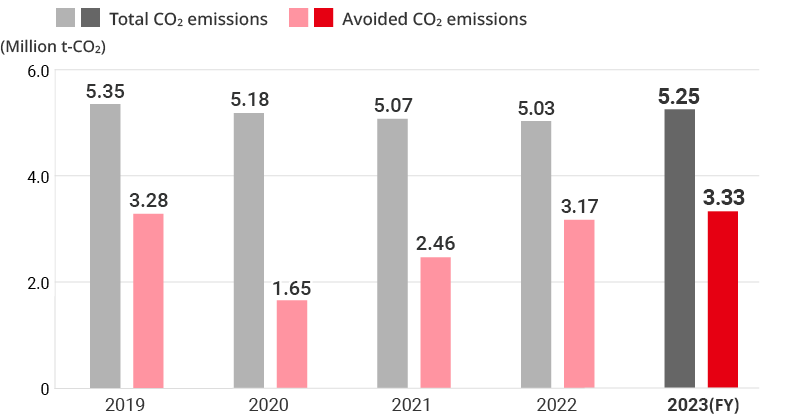
Avoided CO2 Emissions*1
We aim to reduce CO2 emissions throughout the entire supply chain by using our long-cultivated technologies for reducing weight and increasing efficiency. By the early stage of FY2030, we aim to make the amount of our avoided emissions larger than the total CO2 emissions*2. We have also been making efforts toward establishing a life cycle assessment (LCA) evaluation system, which visualizes the environmental burden of a product across its entire life cycle. Through these efforts, we aim to reduce CO2 emissions throughout the entire supply chain. In FY2023, we established the LCA Promotion Expert Meeting under which we are proceeding with Groupwide LCA initiatives.
- *1Calculated as the contribution of the CO2 reduction effect downstream in the supply chain from the use of our products.
- *2Total CO2 emissions are calculated for Scope 1, Scope 2, and Category 1 (Purchased goods and services), Category 2 (Capital goods), Category 3 (Fuel- and energy-related activities not included in Scope 1 and Scope 2), Category 4 (Upstream transportation and distribution), Category 5 (Waste generated in operations), Category 6 (Business travel), and Category 7 (Employee commuting) in Scope 3.
The Group's target (KPI)
FY2030: Achieve total CO2 emissions < avoided CO2 emissions
Trends in total CO2 emissions and avoided CO2 emissions
In FY2024, our avoided CO2 emissions were 3.49 million tons-CO2.
- *Teijin Automotive Technologies NA Holdings Corp. (hereinafter, "TAT-NA"), a consolidated subsidiary in the materials segment that operates the automotive composites business in North America, has been excluded from the scope of aggregation from FY2024 due to it being a discontinued operation. Past figures include TAT-NA, while figures for FY2024 exclude TAT-NA.
- *GHG emissions quantification is subject to uncertainty when measuring activity data, determining emission factors, and considering scientific uncertainty inherent in the Global Warming Potentials.
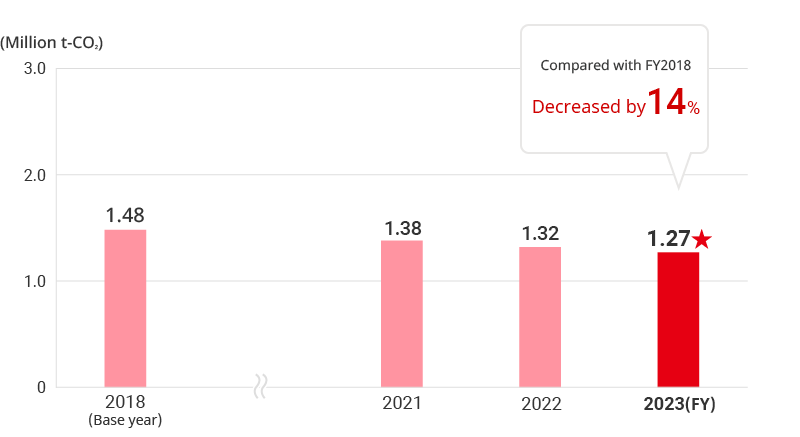
Group CO2 Emissions (Scope 1 + Scope 2)
Through the early phase-out of all coal-fired power generation and the gradual transition to renewable energy sources for our electricity, we are working to decouple our business growth from GHG emissions.
The Group's target (KPI)
- FY2030: 30% reduction (vs. 1.36 million tons-CO2 in FY2018)
- FY2050: Achieve net zero
Trends in Group CO2 emissions
In FY2024, Group CO2 emissions were 1.09 million tons-CO2 (Scope 1: 0.58 million tons-CO2, Scope 2: 0.51 million tons-CO2).
- *Includes CO2, methane, and N2O
- *CO2 emissions are calculated with the Greenhouse Gas (GHG) Protocol as reference. The amount of CO2 emissions equivalent to the amount of energy sold to other companies has not been deducted from this data. With regard to coefficients for fuel, we use emissions coefficients based on the Law Concerning the Promotion of the Measures to Cope with Global Warming. As for emissions coefficients for electricity, we use standard emissions coefficients of individual electric power companies for power purchased in Japan. For power purchased overseas, we use power company-specific coefficients, in principle. However, in cases where the power company-specific coefficient is unknown, we apply the latest available International Energy Agency (IEA) country-specific emissions coefficient. As TAT-NA is a discontinued operation, it has been excluded from the scope of aggregation starting from FY2024. In accordance with the GHG Protocol, recalculations were applied retroactively to the base fiscal year, excluding TAT-NA. Note that including TAT-NA in the aggregation would result in emissions of 1.23 million tons-CO2 for FY2024, and this figure is not subject to third-party assurance.
- *GHG emissions quantification is subject to uncertainty when measuring activity data, determining emission factors, and considering scientific uncertainty inherent in the Global Warming Potentials.
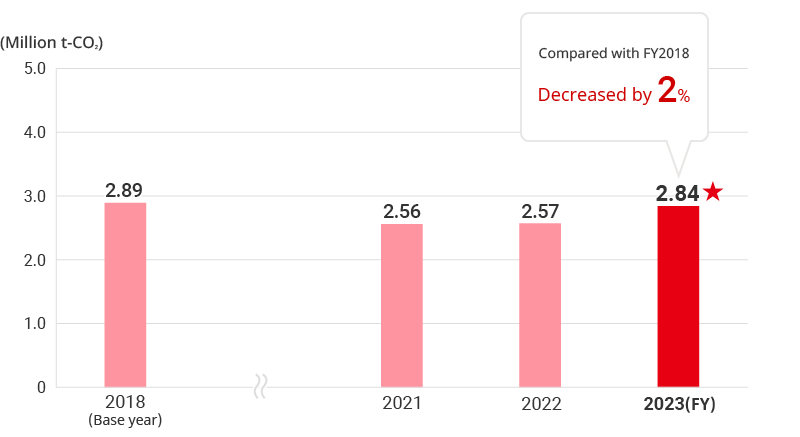
Supply Chain CO2 Emissions
We have set a KPI pertaining to two-thirds of our total supply chain CO2 emissions and are working to reduce these emissions across the entire supply chain.
The Group's target (KPI)
FY2030: 15% reduction (vs. 2.76 million tons-CO2 in FY2018)
Trends in supply chain CO2 emissions
In FY2024, supply chain CO2 emissions were 2.52 million tons-CO2.
- *Targets Category 1 (purchased goods and services) of Scope 3 emissions. However, this excludes Category 1 emissions related to products purchased for resale in the Fibers & Products Converting Business. Calculated by multiplying the purchase weight or purchase amount of purchased goods and services by the emission intensity per unit of weight or amount. The emission intensity per unit of amount is based on the unit data from the Ministry of the Environment's "Emissions Unit Values for Accounting of Greenhouse Gas Emissions, etc., by Organizations Throughout the Supply Chain (Ver. 3.4) (March 2024)" (Emission Unit DB V3.4). The emission intensity per unit of weight is based on the unit data from the Ecoinvent Database (operated by the Ecoinvent Association) or the LCA for Experts (GaBi) Database (operated by Sphera). As TAT-NA is a discontinued operation, it has been excluded from the scope of aggregation starting from FY2024. In accordance with the GHG Protocol, recalculations were applied retroactively to the base fiscal year, excluding TAT-NA. Note that calculating the emissions for FY2024 in cases where TAT-NA is included in the aggregation would be difficult, so it is excluded from the scope of this disclosure.
- *GHG emissions quantification is subject to uncertainty when measuring activity data, determining emission factors, and considering scientific uncertainty inherent in the Global Warming Potentials.
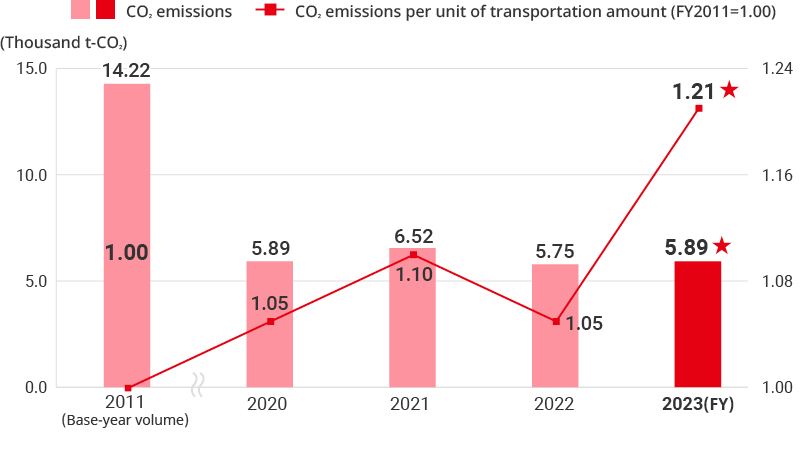
CO2 Emissions in the Logistics Sector
In FY2024, CO2 emissions in the logistics sector amounted to 6.48 thousand tons-CO2, a decrease of 0.22 thousand tons-CO2 from FY2023. In FY2024, due to factors including a decrease in the volume of overseas shipments from the carbon fibers business to the Teijin Group and the utilization of storage warehouses for the new healthcare business, the overall total freight transport volume decreased (by 1,883 thousand tons-km/year). A change in the transaction terms for Teijin Healthcare led to a decrease in shipment volume and large-lot shipments, causing a decline in loading efficiency. Consequently, the CO2 emissions per unit of transportation amount in the logistics sector for the Group as a whole increased by 0.01 year on year. Furthermore, the basic unit of intensity per thousand tons-km (tons-CO2/thousand tons-km) was 1.38, based on an index where FY2011 is set to one. In FY2025, as in the previous fiscal year, we will strive to reduce our emissions intensity by continuing to drive initiatives such as shortening drayage distances by changing the port of discharge and implementing street turns, in addition to switching to larger vehicles (expanding consolidated shipments), improving truck loading efficiency, and promoting a modal shift.
Trends in CO2 emissions in the logistics sector
- *The scopes for calculating CO2 emitted by logistics for each fiscal year are as follows.
FY2011: Teijin Limited (excluding the aramid fiber business), Teijin Film Solutions Ltd., and the former Teijin Fiber Co., Ltd.'s apparel business that was consolidated with Teijin Frontier Co., Ltd.
FY2020: Teijin Limited, Teijin Frontier Co., Ltd., Teijin Pharma Limited, and Teijin Cordley Limited (*)Teijin Film Solutions Ltd. and Teijin Engineering Ltd. are not included.
FY2021 to FY2023: Teijin Limited, Teijin Frontier Co., Ltd., Teijin Pharma Limited, and Teijin Cordley Limited (*)Teijin Engineering Ltd. is not included.
Since FY2024: Teijin Limited, Teijin Frontier Co., Ltd., Teijin Pharma Limited, and Teijin Cordley Limited (*)Teijin Engineering Ltd. is not included. (*)Added the Composites Business Unit to Teijin Limited. - *GHG emissions quantification is subject to uncertainty when measuring activity data, determining emission factors, and considering scientific uncertainty inherent in the Global Warming Potentials.
- *CO2 emissions in the logistics sector are calculated in accordance with the revised Act on the Rational Use of Energy.
- *In November 2025, we revised the CO2 emissions and CO2 emissions intensity figures for FY2021 and FY2023 in the logistics sector.